Automated Assortment Analysis (A³) Tool
Retail analytics platform for category managers to analyse and optimise product assortments
Overview
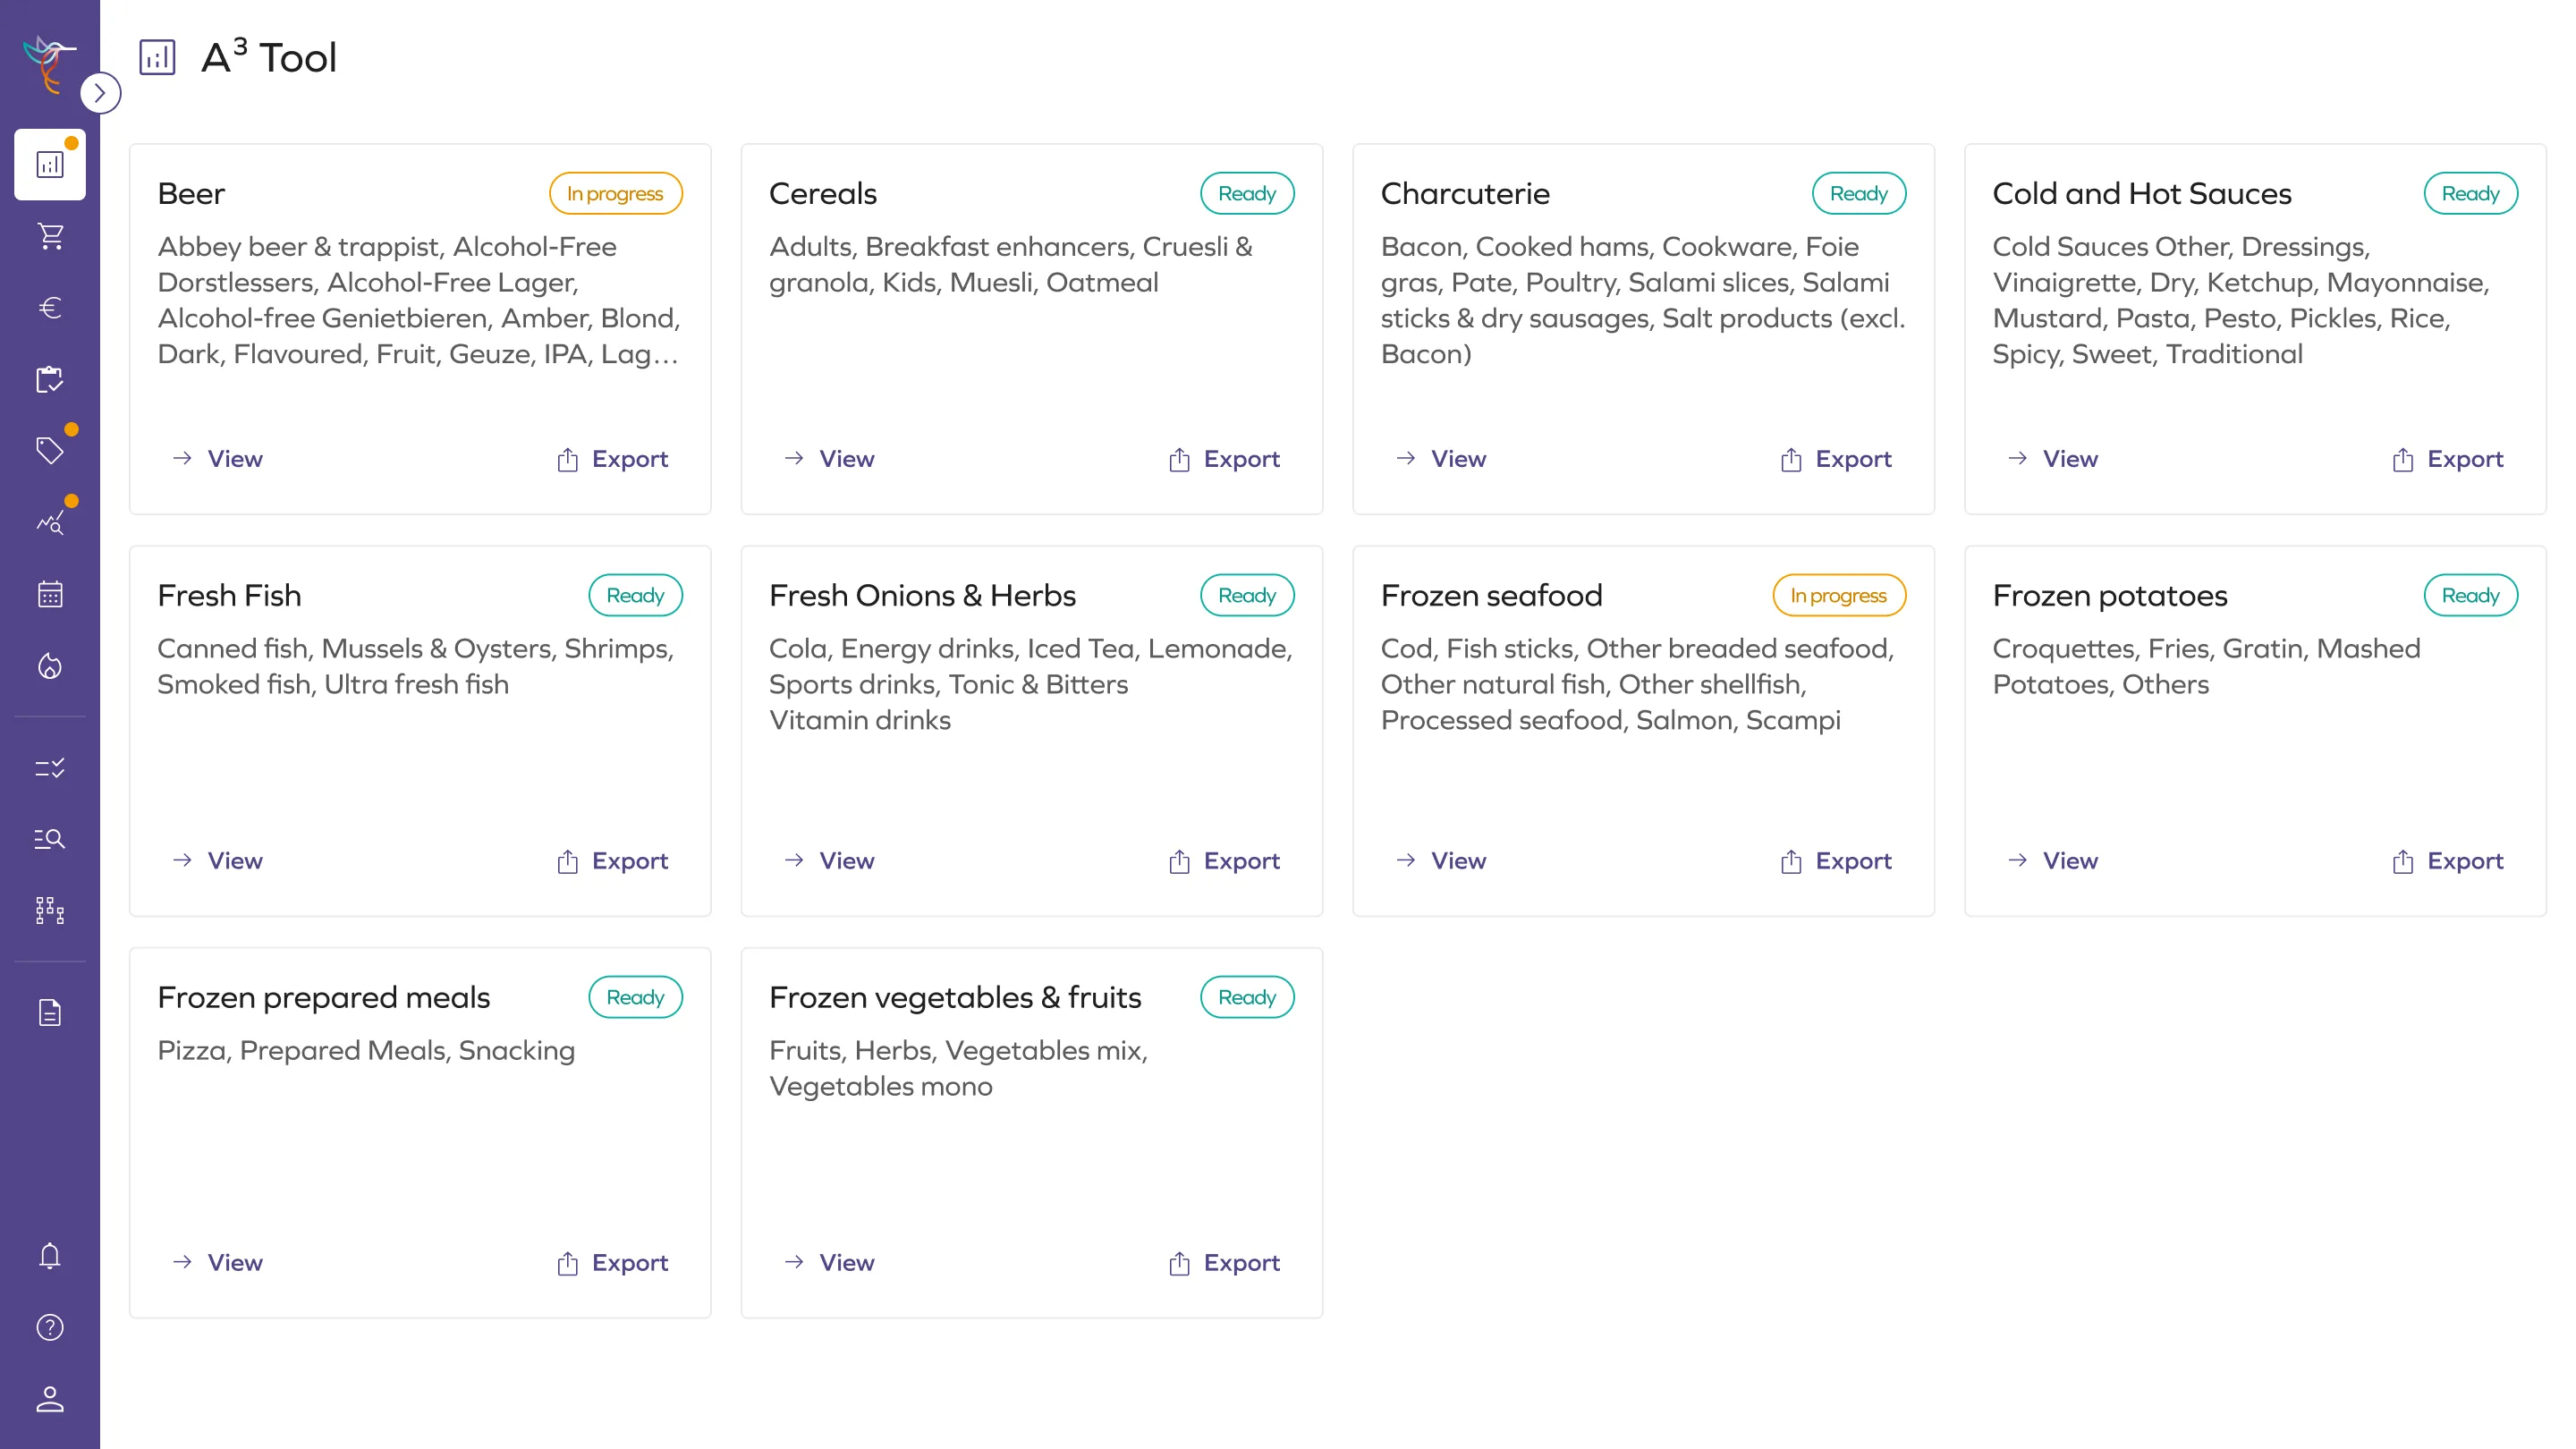
The A³ Tool (Automated Assortment Analysis) helps retailers identify blind spots, optimise product offerings, and improve category performance. Users need to quickly compare thousands of product attributes across competitors and regions, incorporating market insights such as Nielsen data.
The platform was designed to streamline assortment analysis and support faster, fact-based decisions across complex FMCG product datasets.
- Role
- Senior Product Designer
- Client
- Daltix
- Scope
- B2B Retail Analytics Platform
- Duration
- Aug 2023 - Feb 2026
- Location
- Lisbon & Remote
Challenges
- Manual assortment analysis is labour-intensive, slow, and error-prone
- Users struggle to merge multiple data sources into a single view
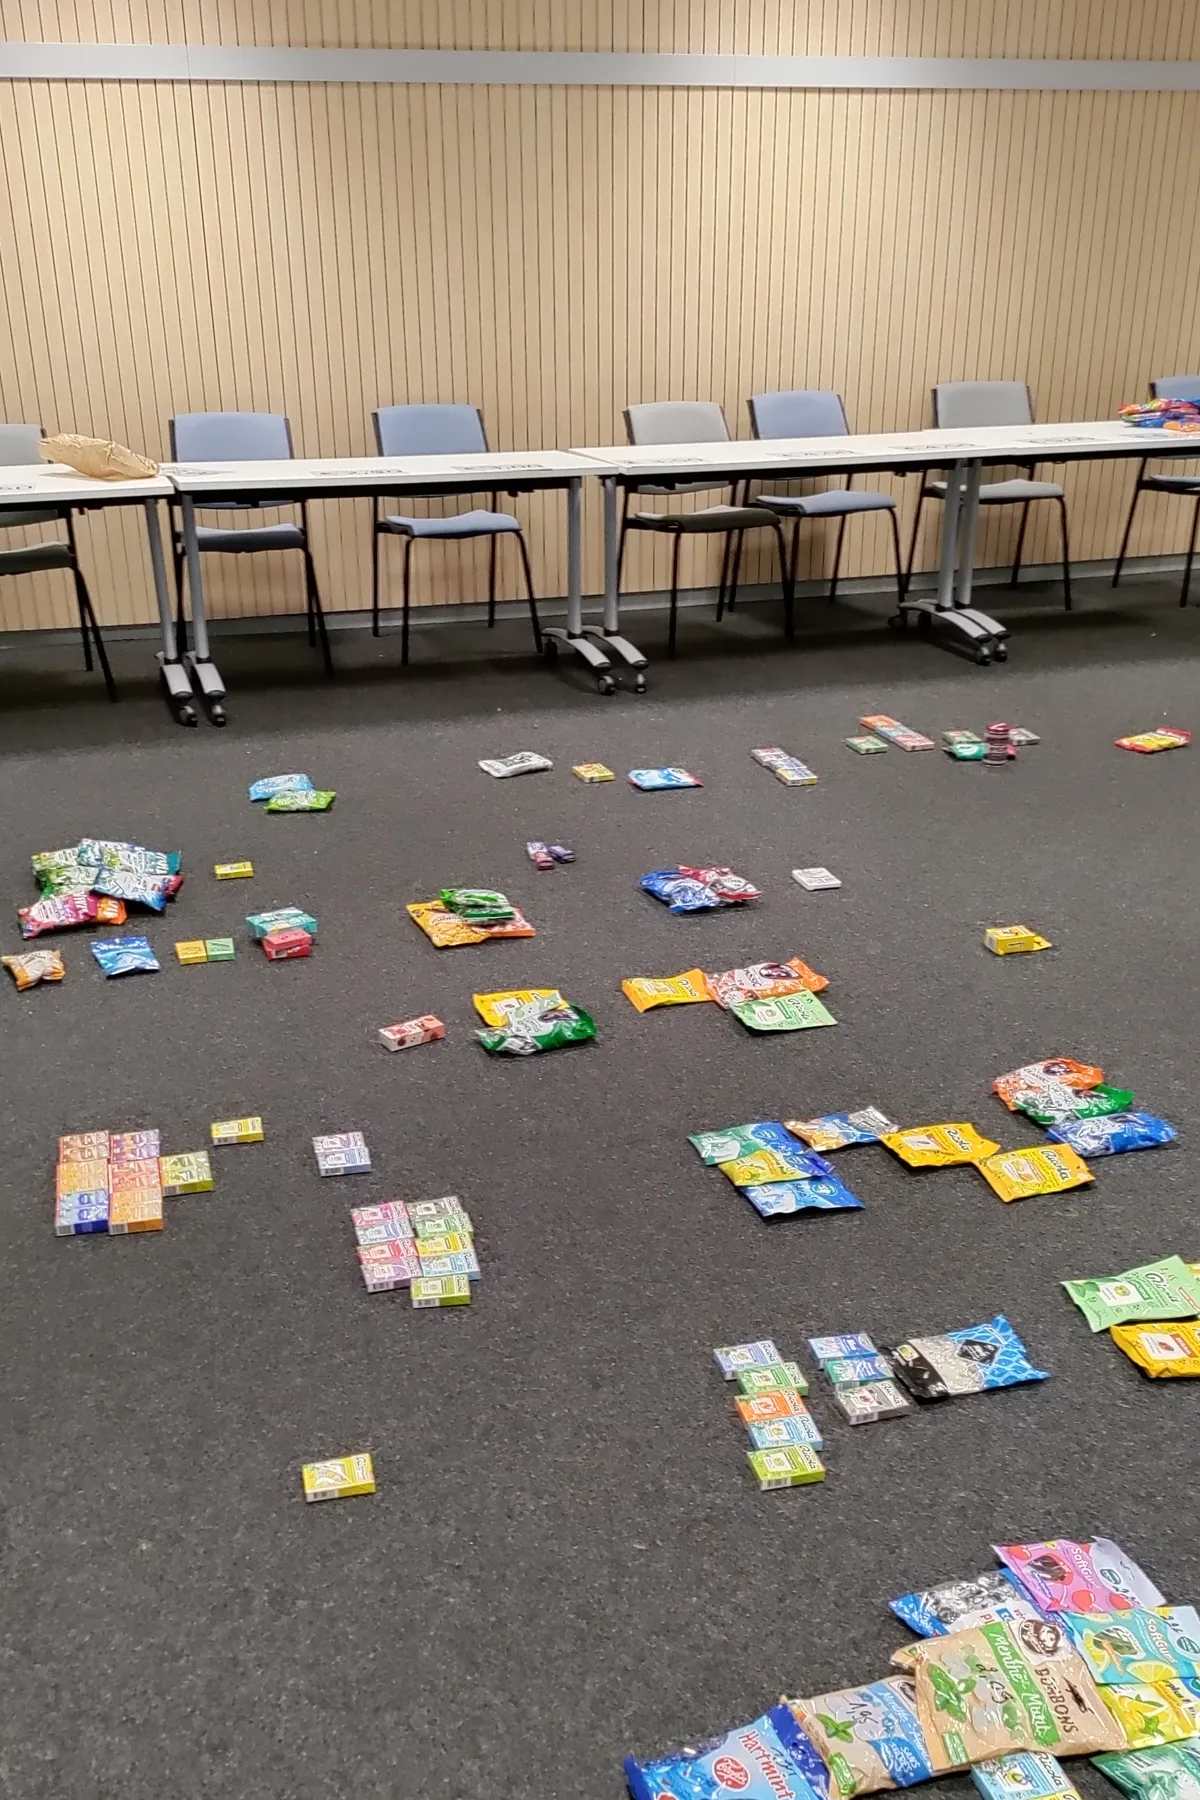
- High-density, multi-attribute FMCG data is handled manually — sometimes literally laid out on the floor in grids
- Needed to combine human oversight with AI-assisted automation
Role
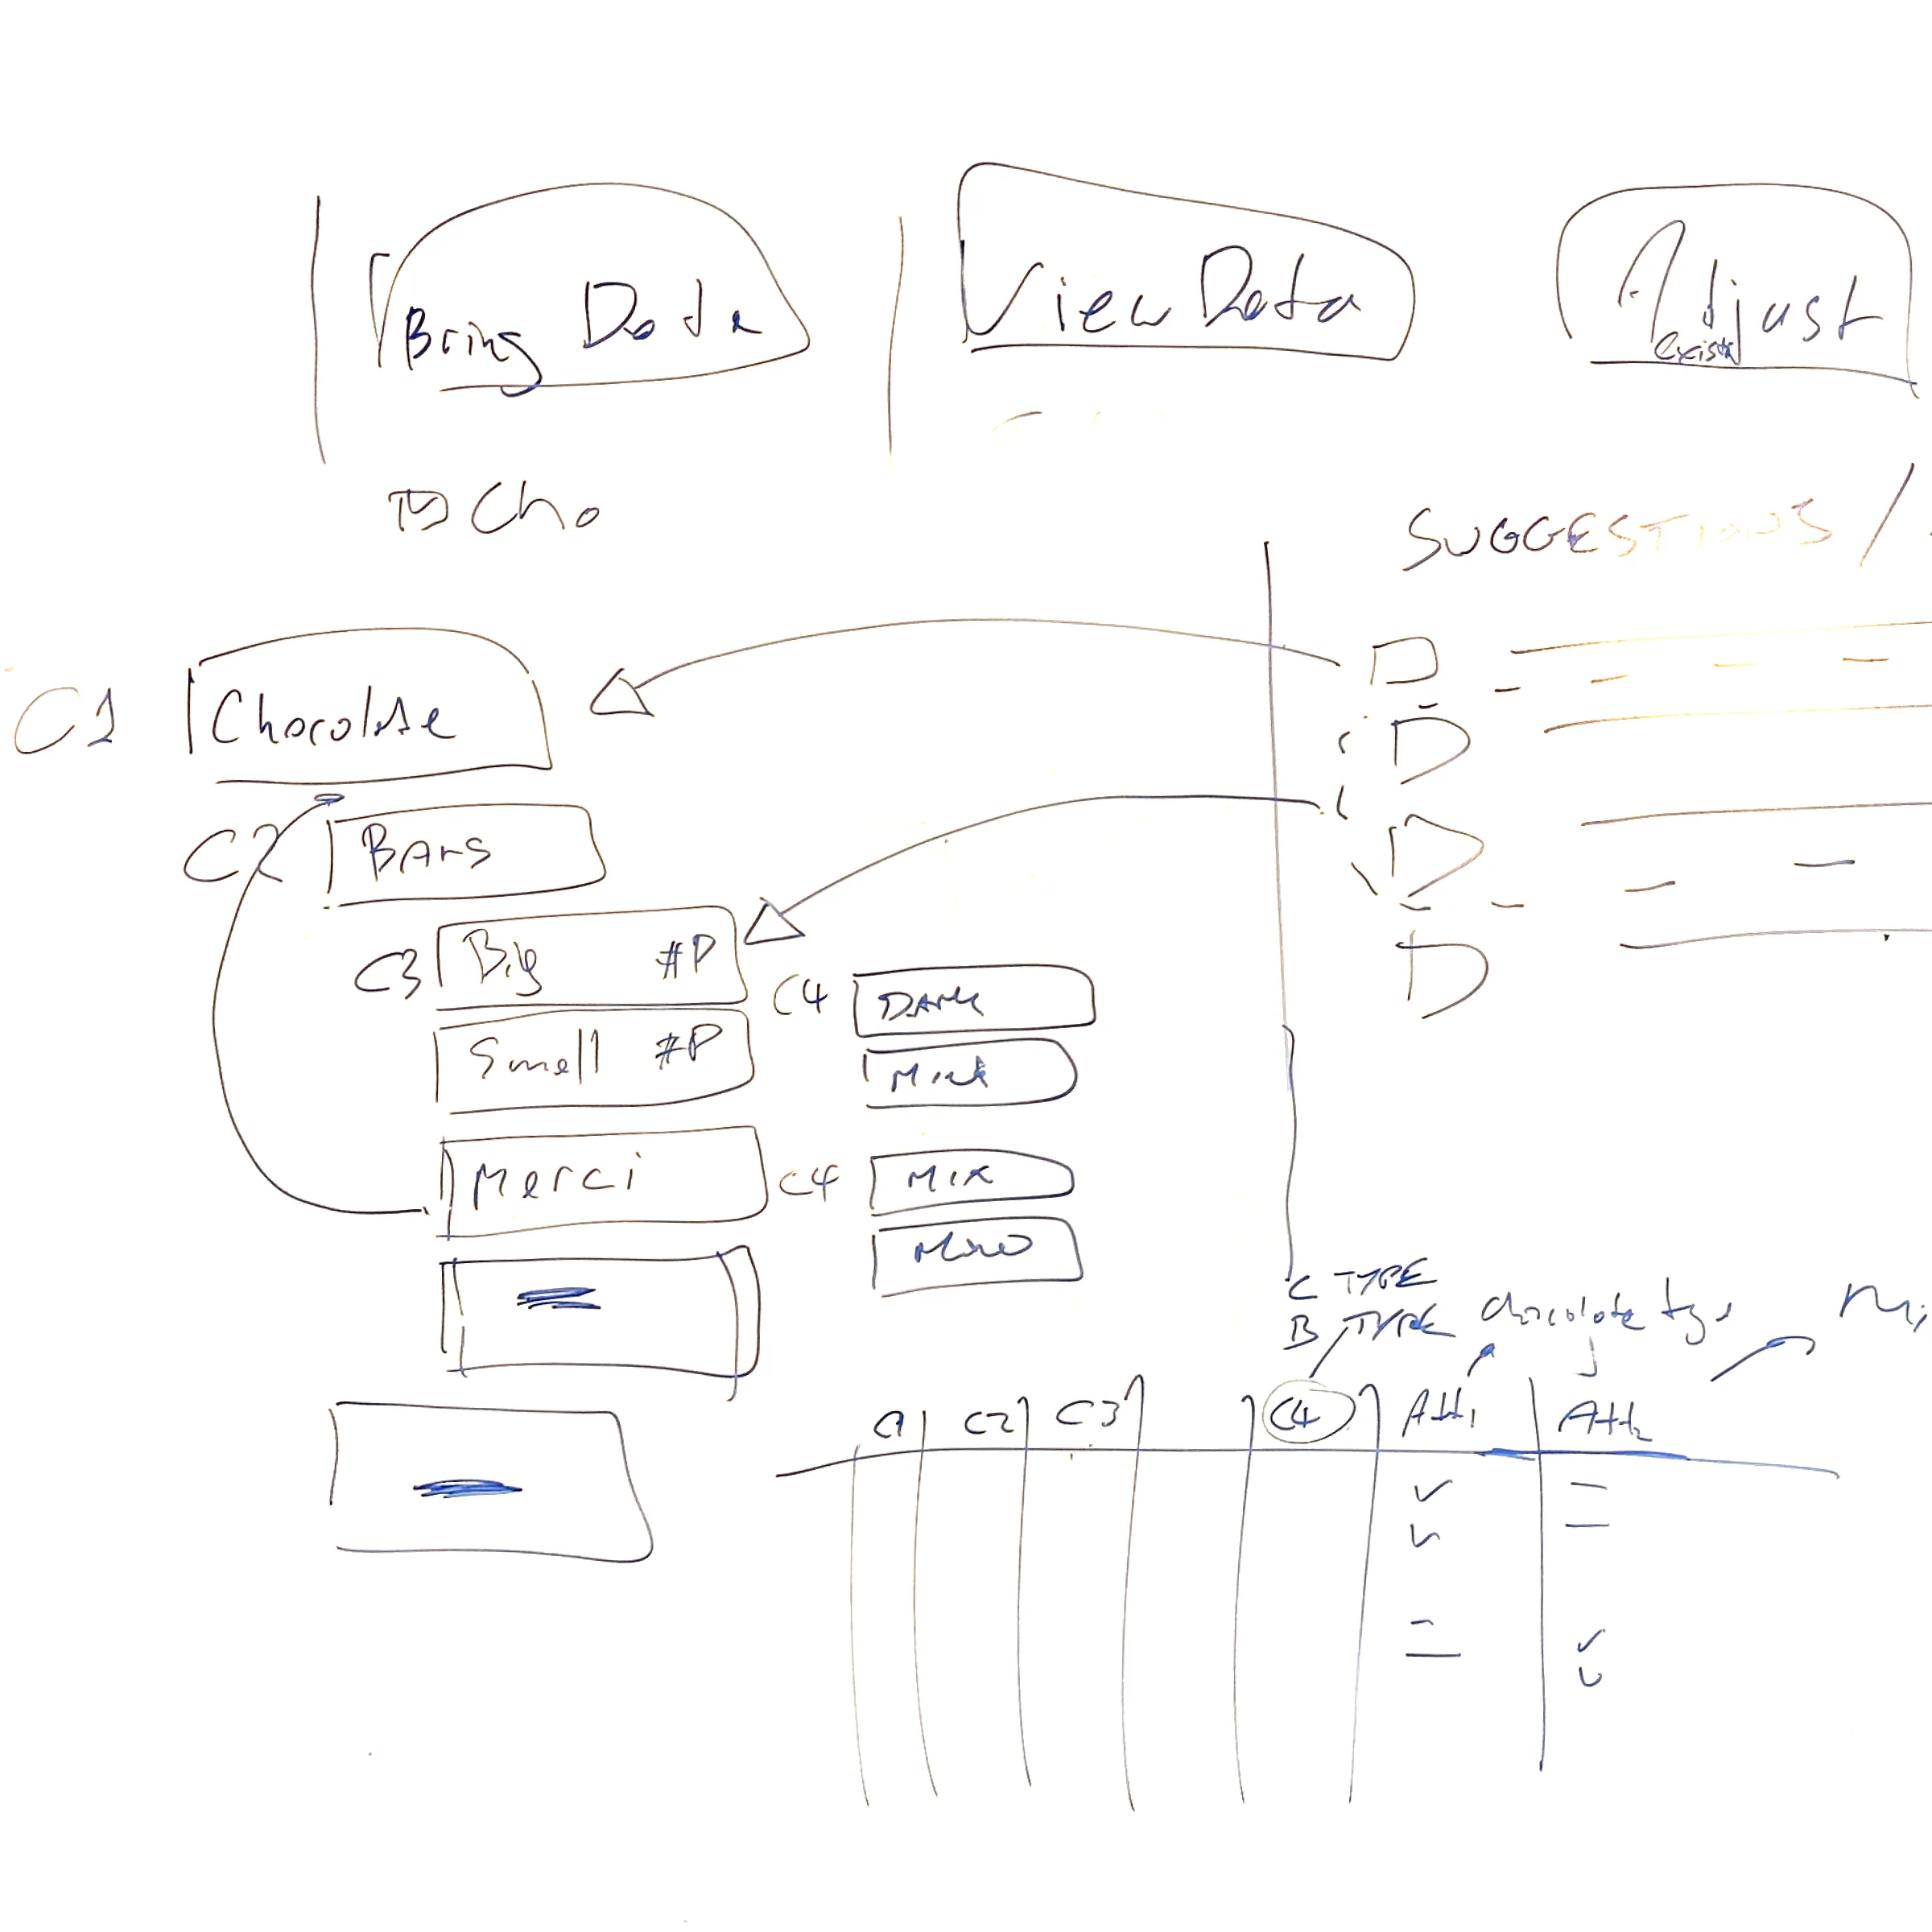
- Led UX/UI design for A³ from inception — a two-person design team (Head of Product Design + myself), starting on a whiteboard
- Conducted end-to-end UX: interviews with Category Managers at CLP, data analysis, wireframing, prototyping, and functional design
- Designed data tables, pivot tables, grid cards, and charts for multi-perspective visualisation, supporting category managers, buyers, marketing, and store managers
- Delivered a data app achieving around 70% adoption at launch, increasing to over 80% after one month — demonstrating strong user engagement and usability
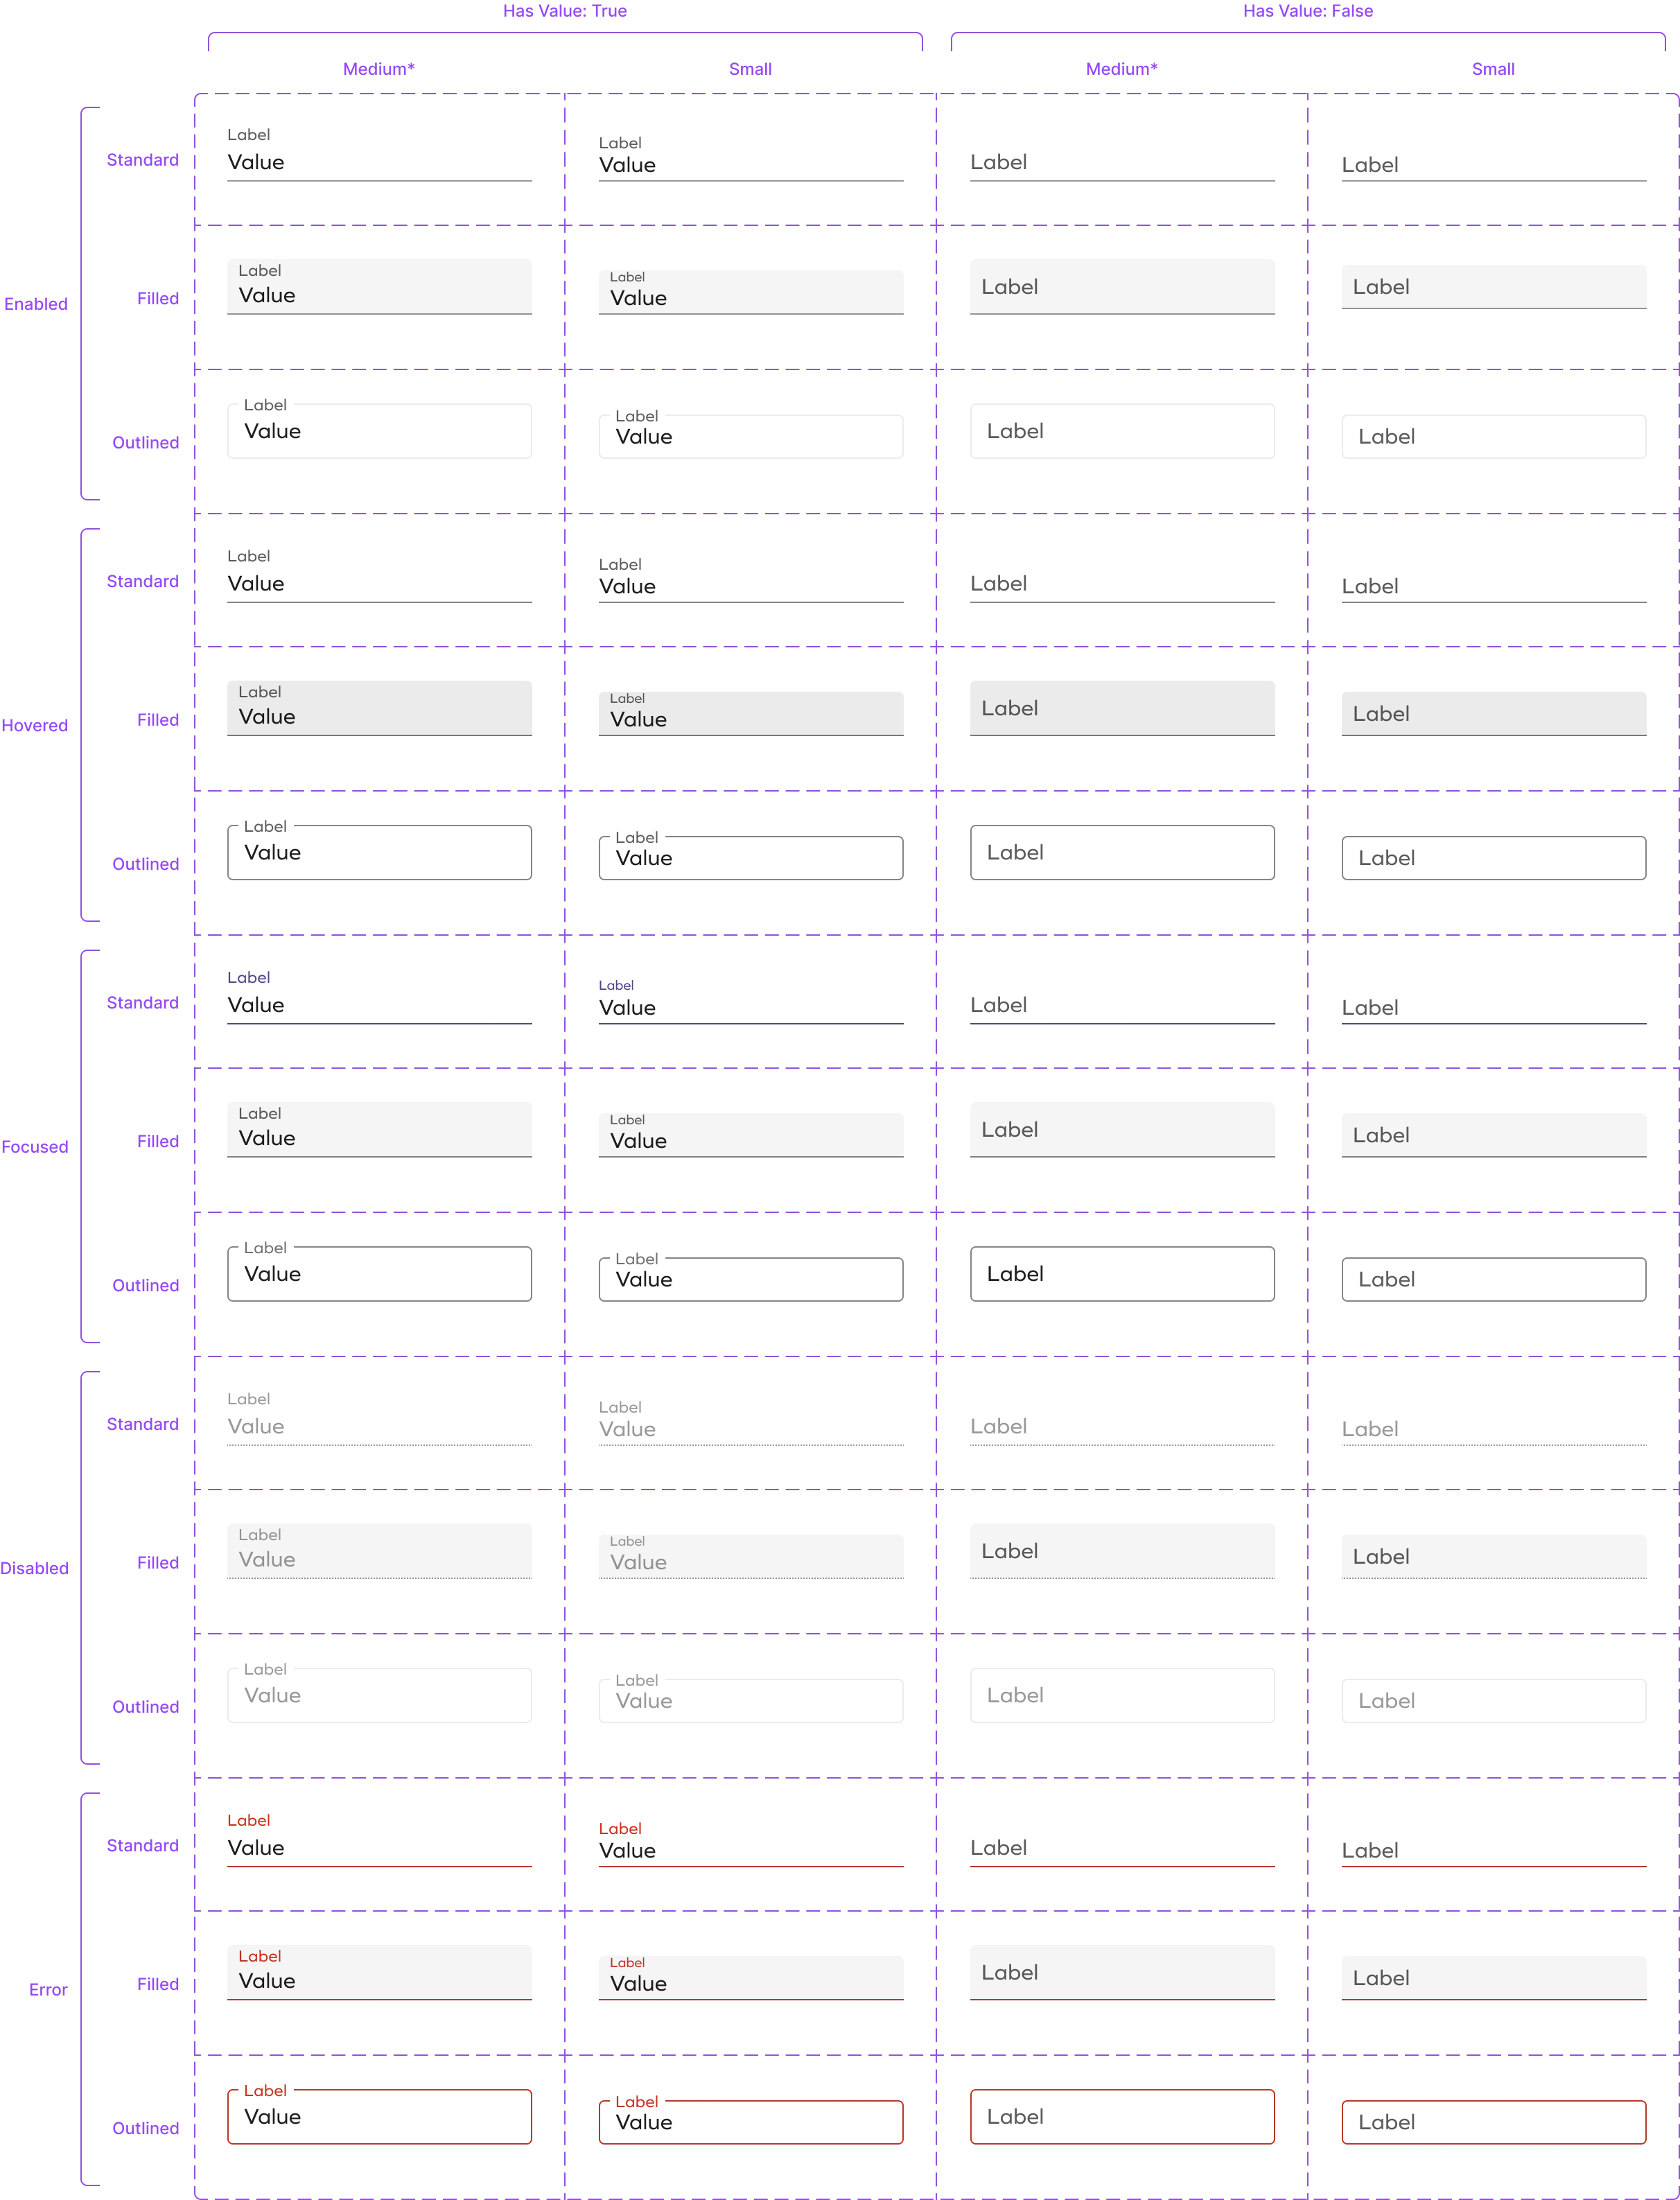
- Established a scalable MUI-based design system for consistent UI across multiple data-intensive apps
Solution
The A³ tool digitizes and streamlines assortment analysis, allowing retailers to compare products, integrate market data, and combine AI-driven insights with expert review.
Streamlined Assortment Planning
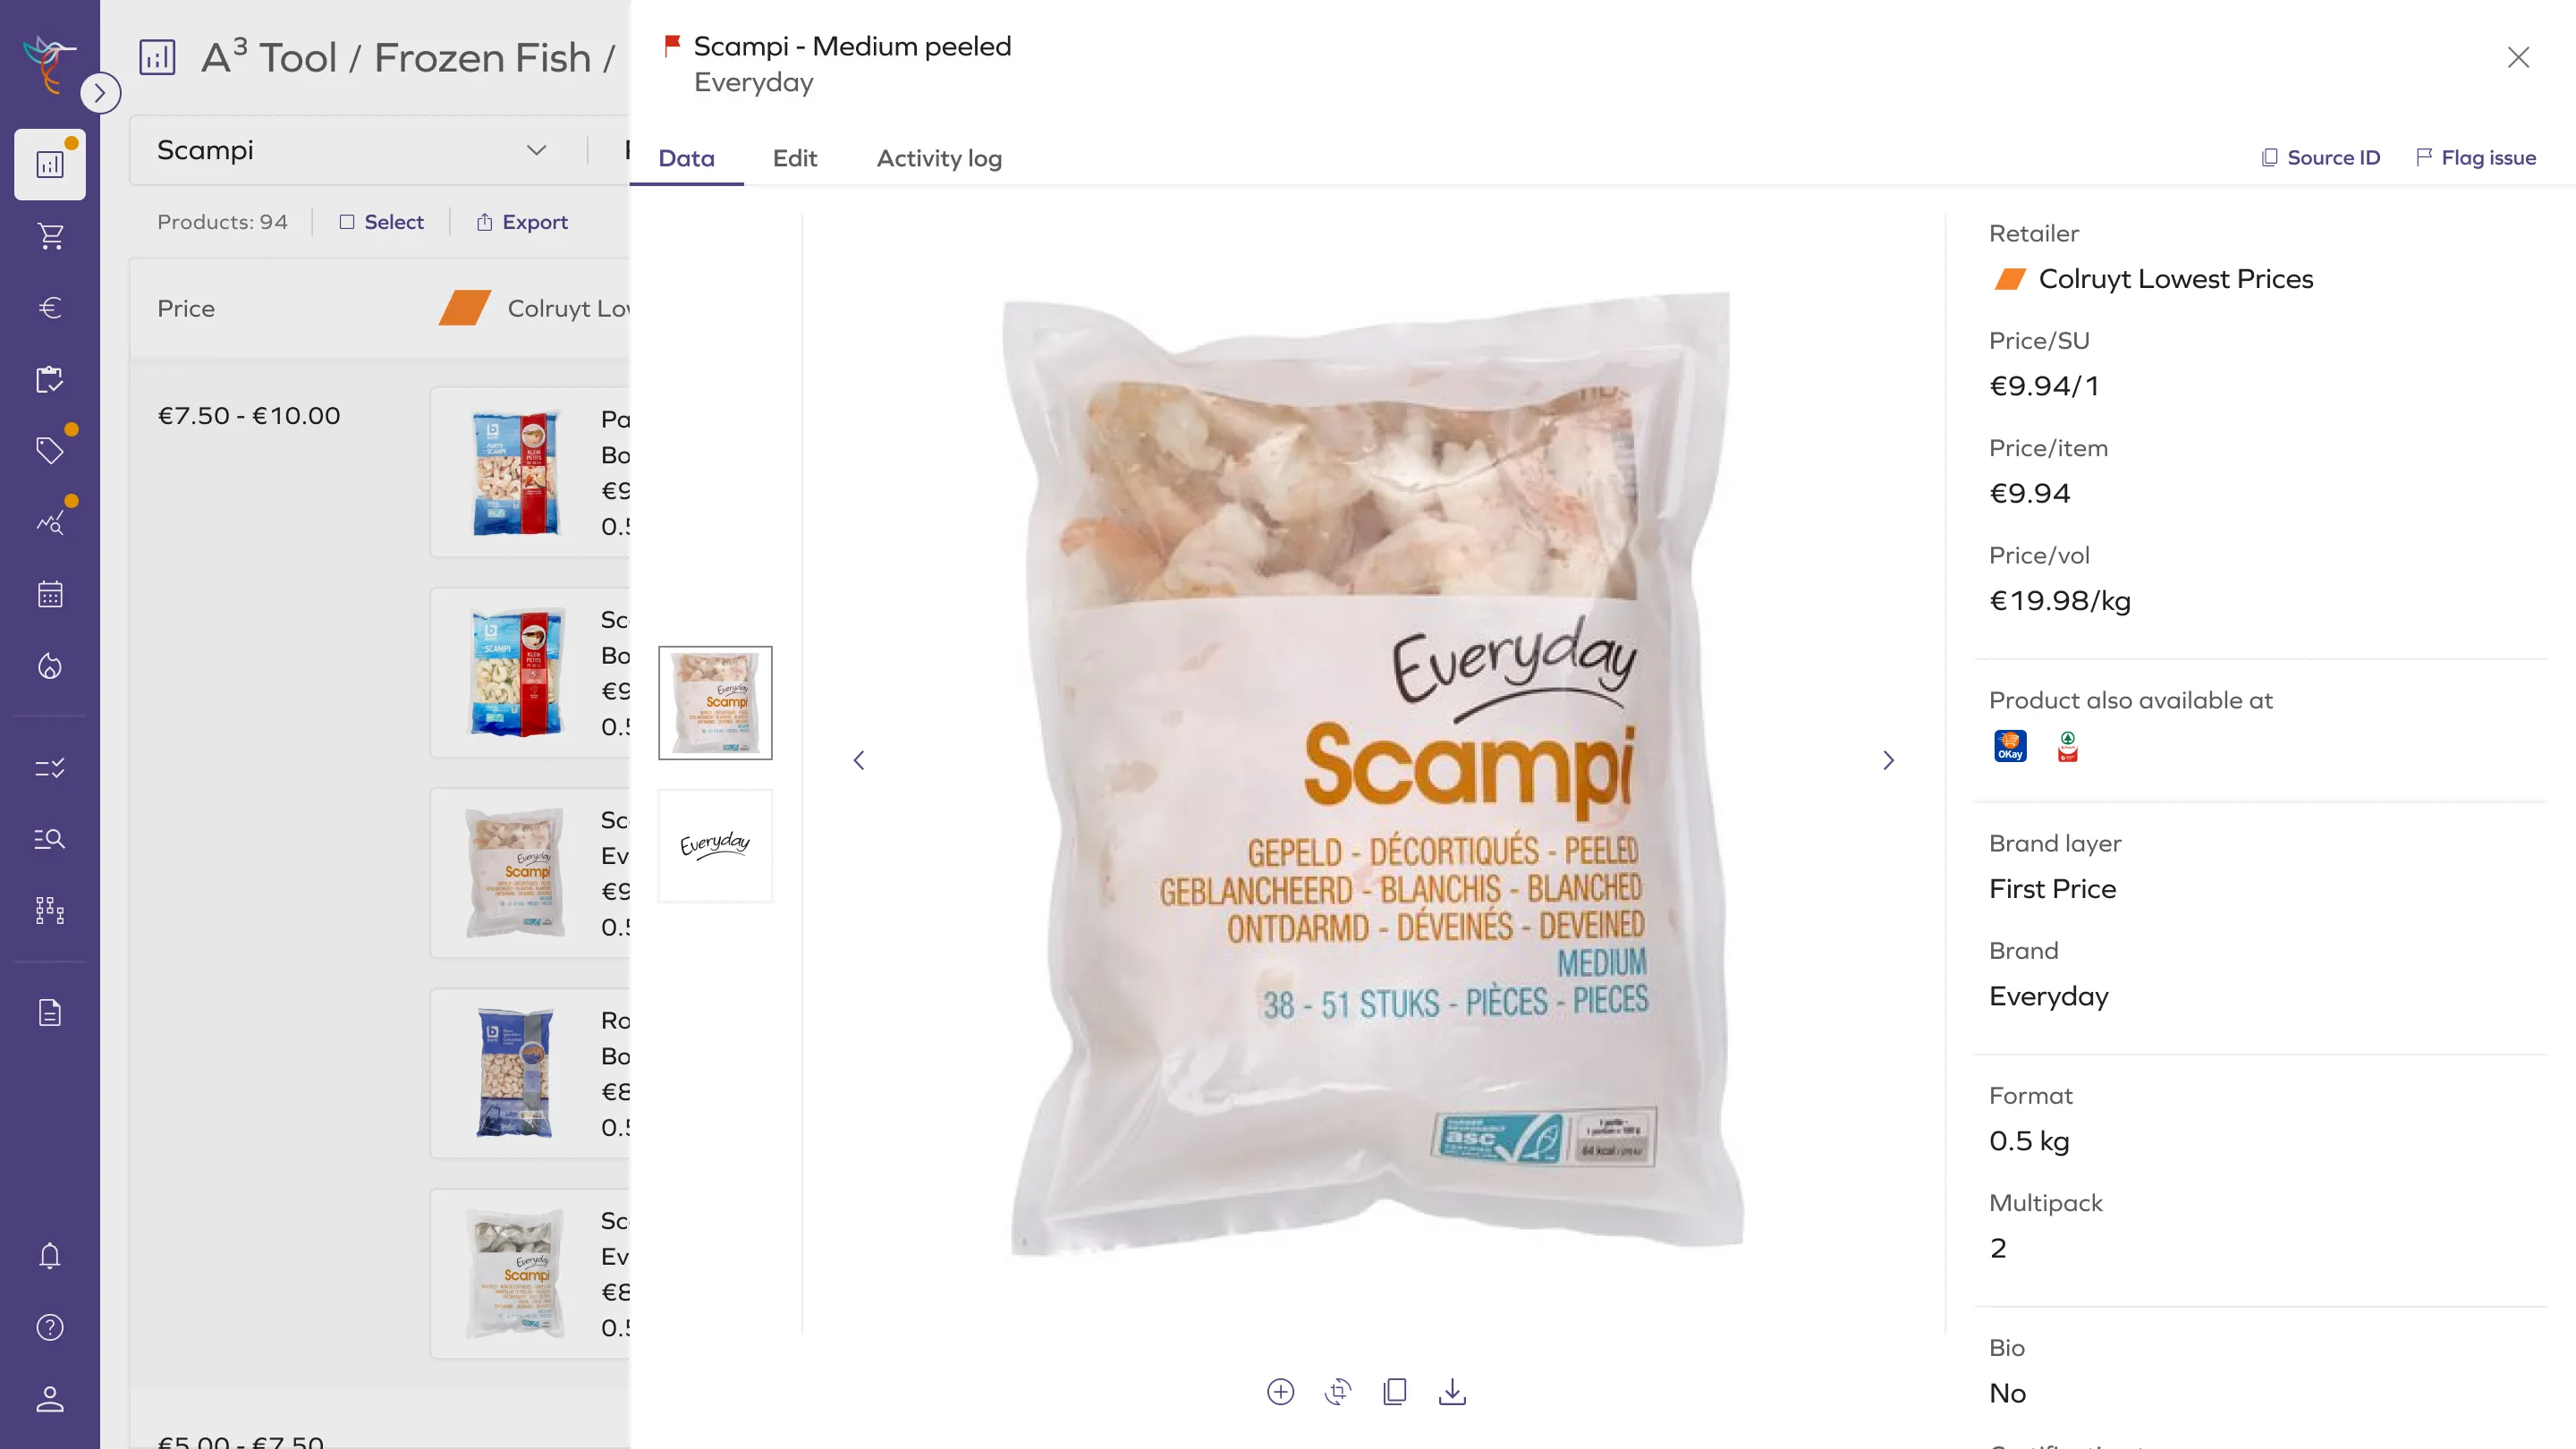
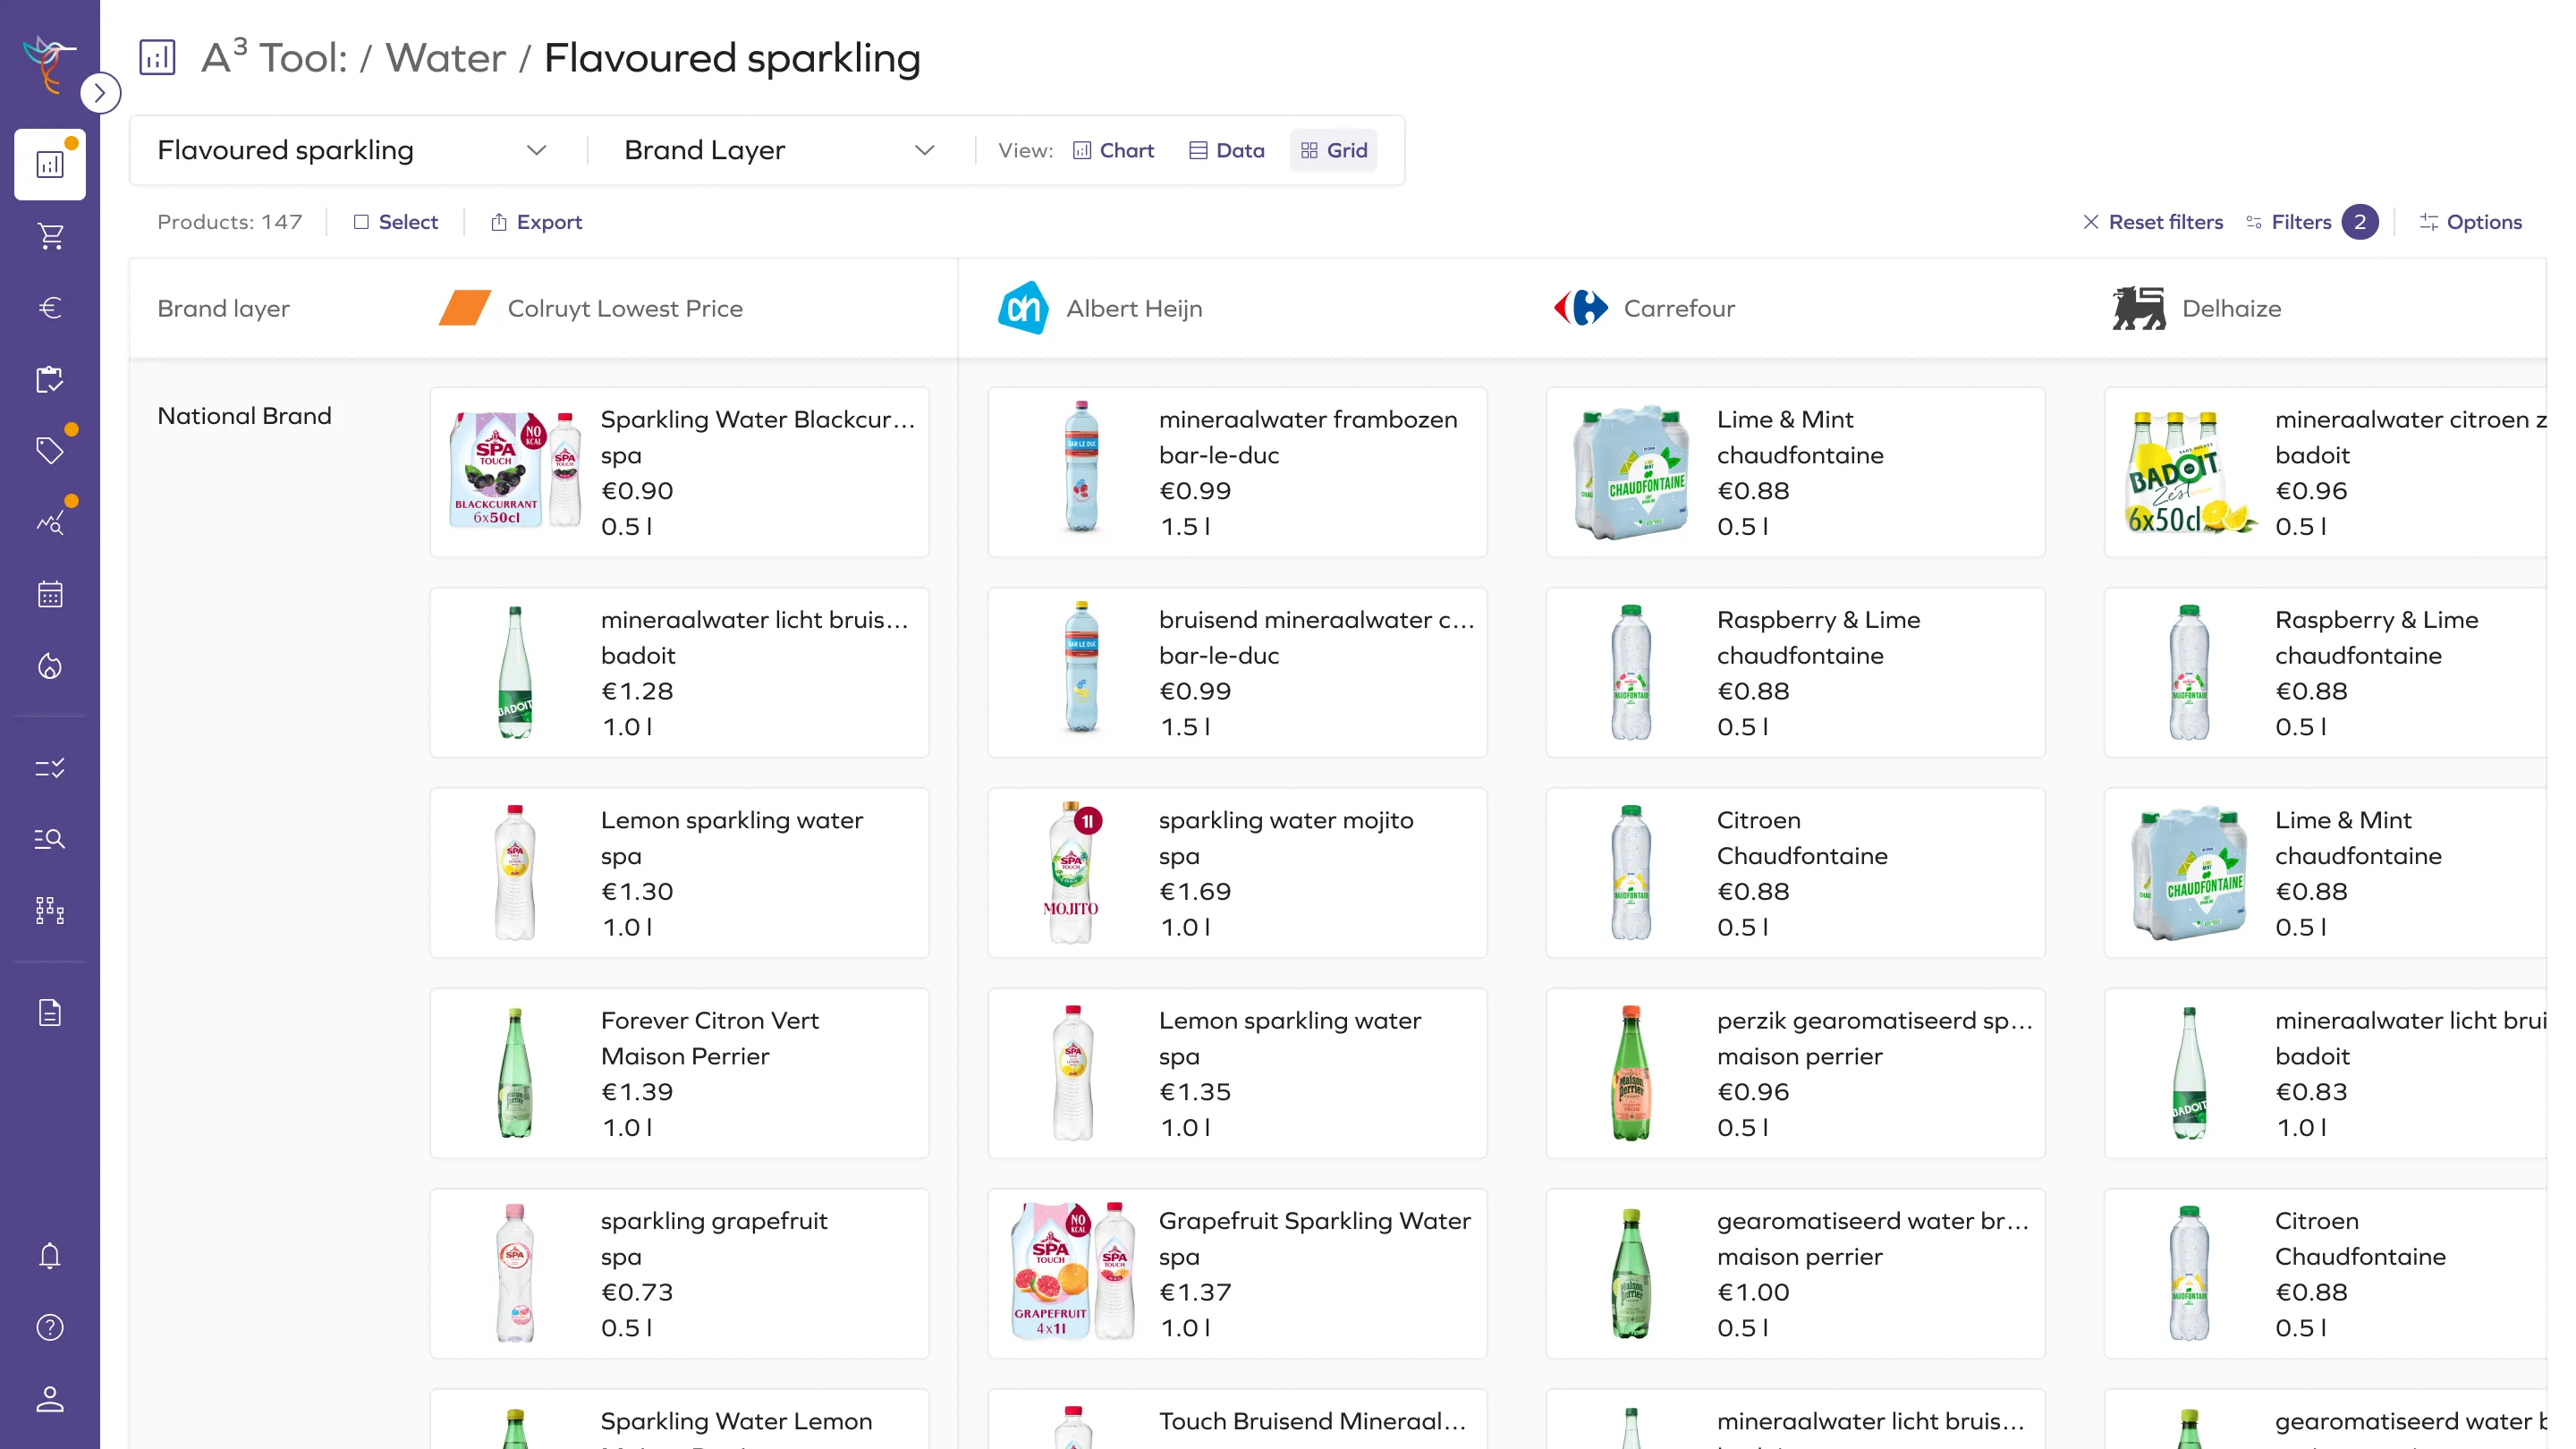
The platform brings together product attributes, competitor assortments, and market data in a single interface, allowing users to review and compare categories more efficiently.
- Enabled users to view competitive overview in a few clicks
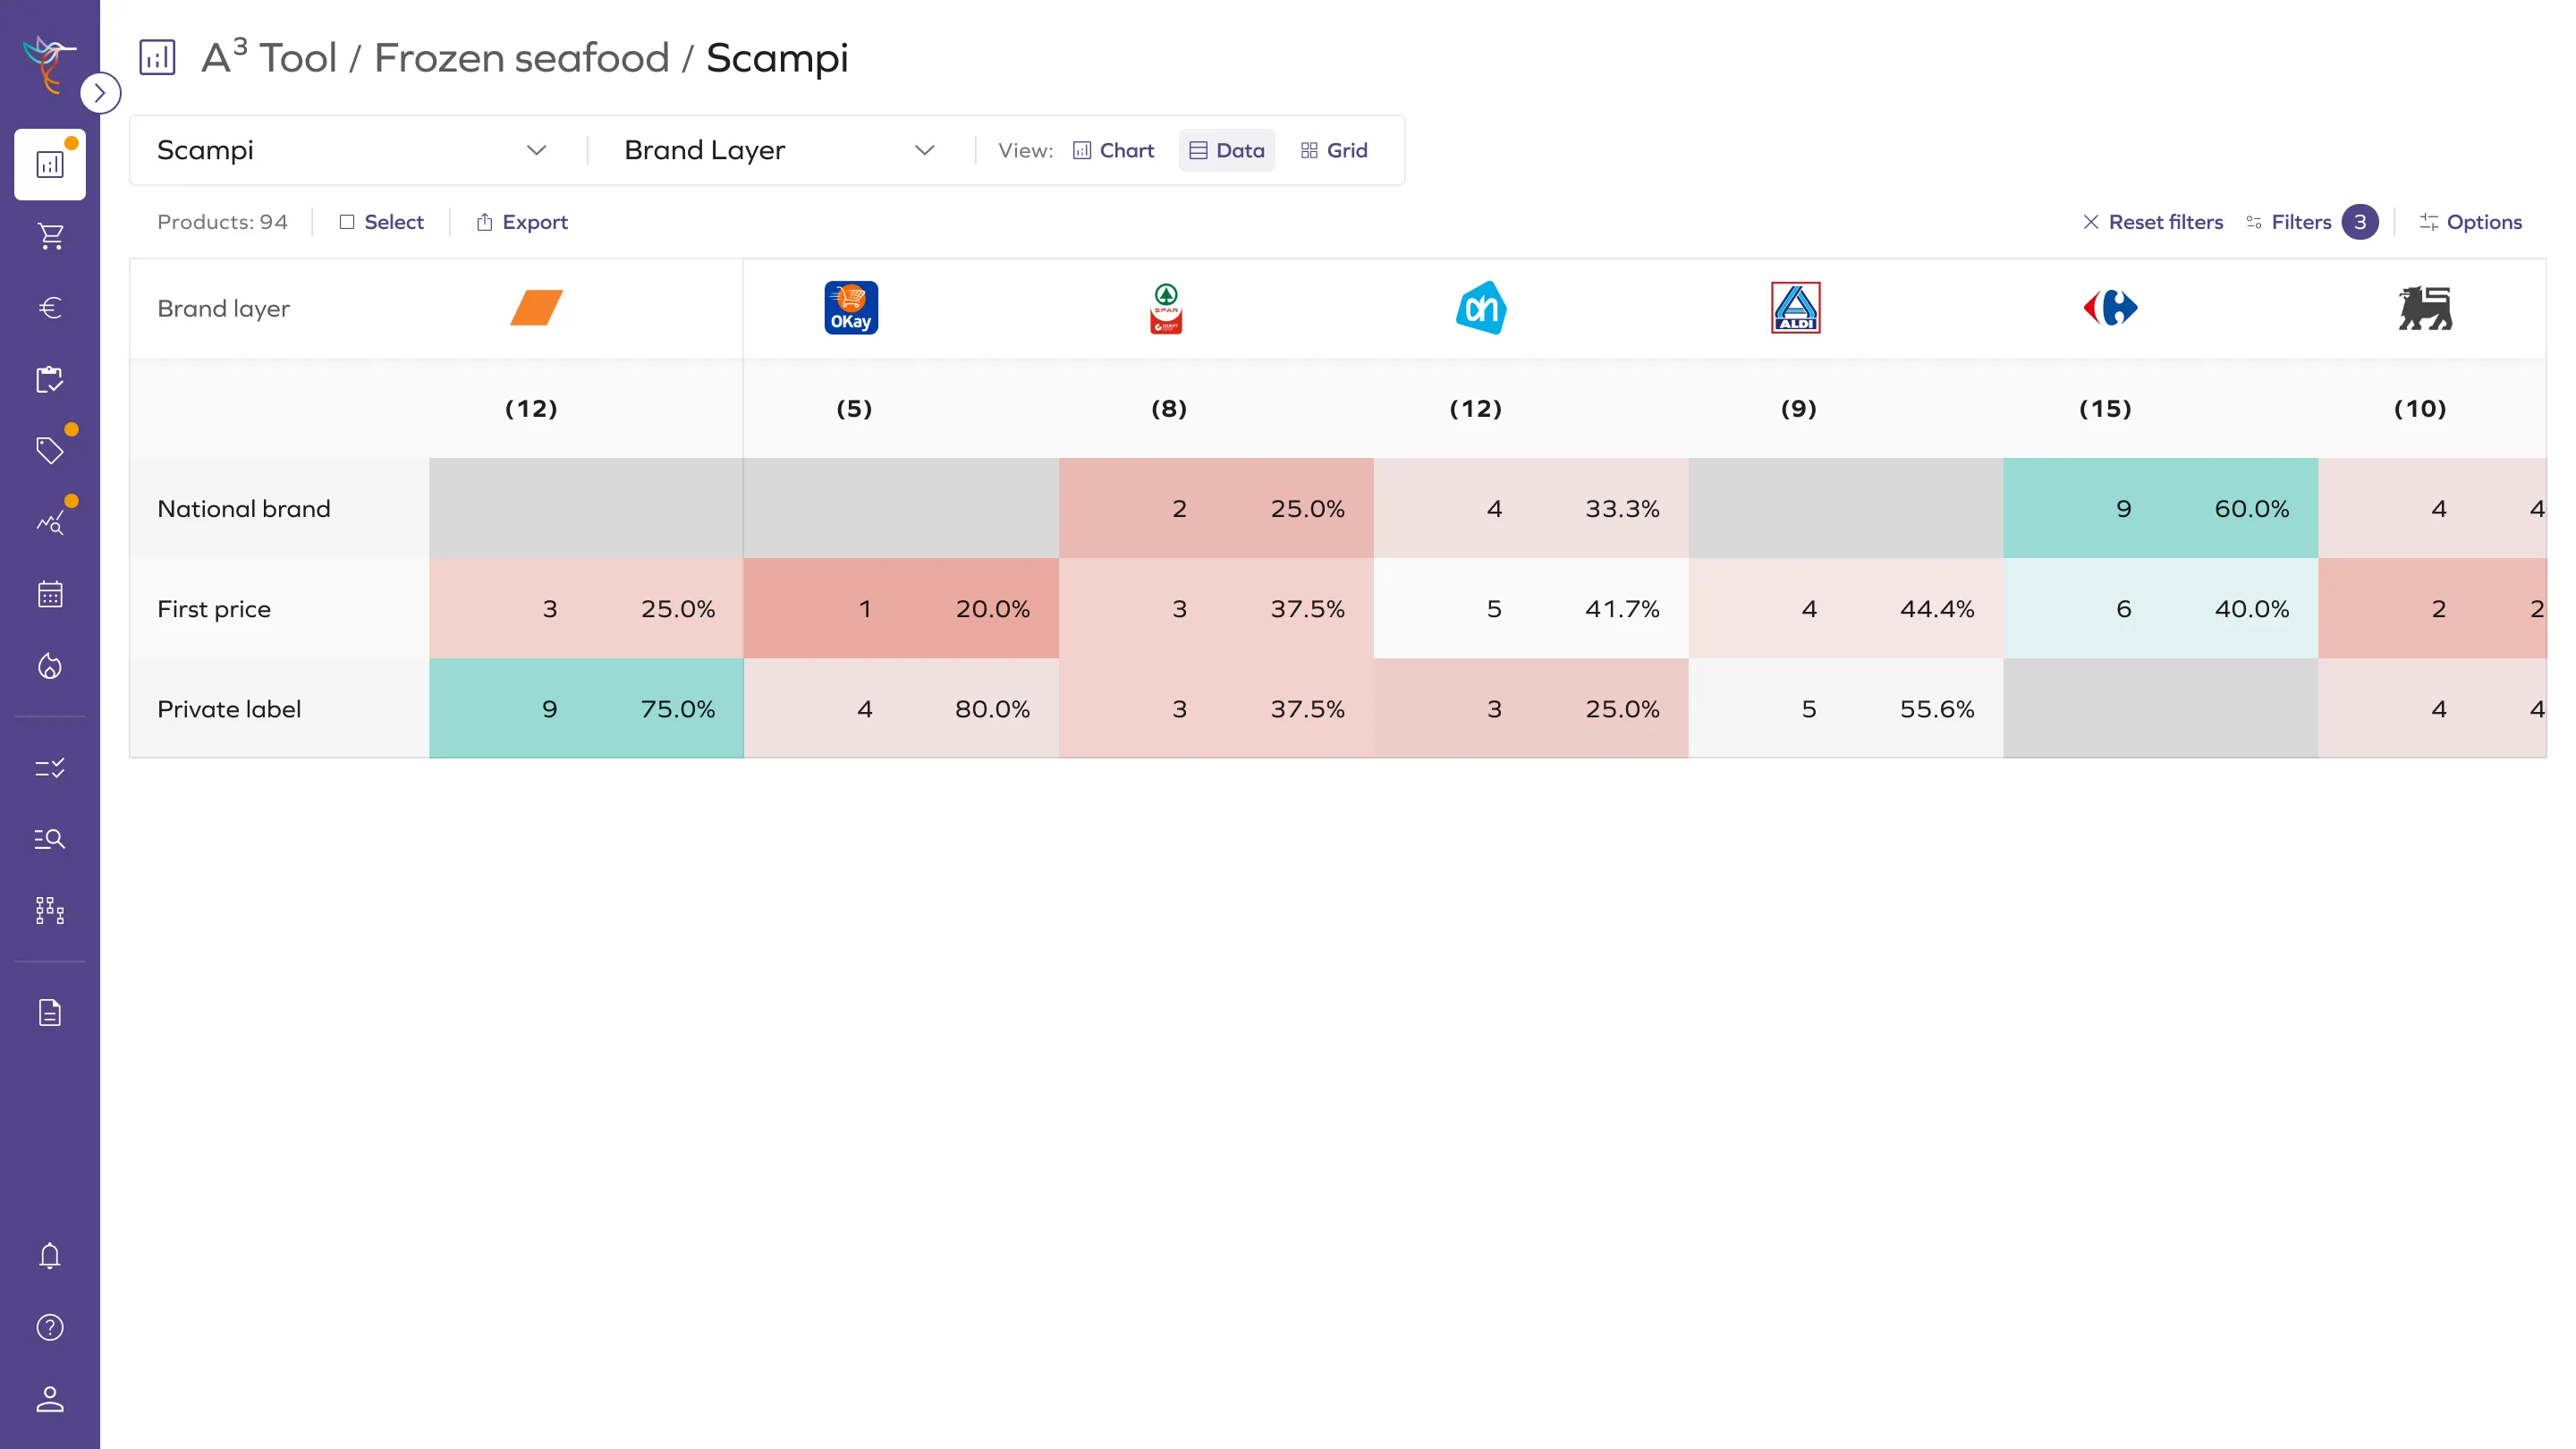
- Compared products by detailed attributes (e.g., fruit percentage in jams, scampi size)
- Integrated Nielsen and other sales data for fact-based decisions
- High-confidence insights automatically highlighted
- Edge cases flagged for expert review
- Reduced manual effort while preserving user control
AI + Human-in-the-Loop
Automated analysis highlights patterns and potential gaps across large product datasets, while users retain control to review and validate the results.
Multi-role Support
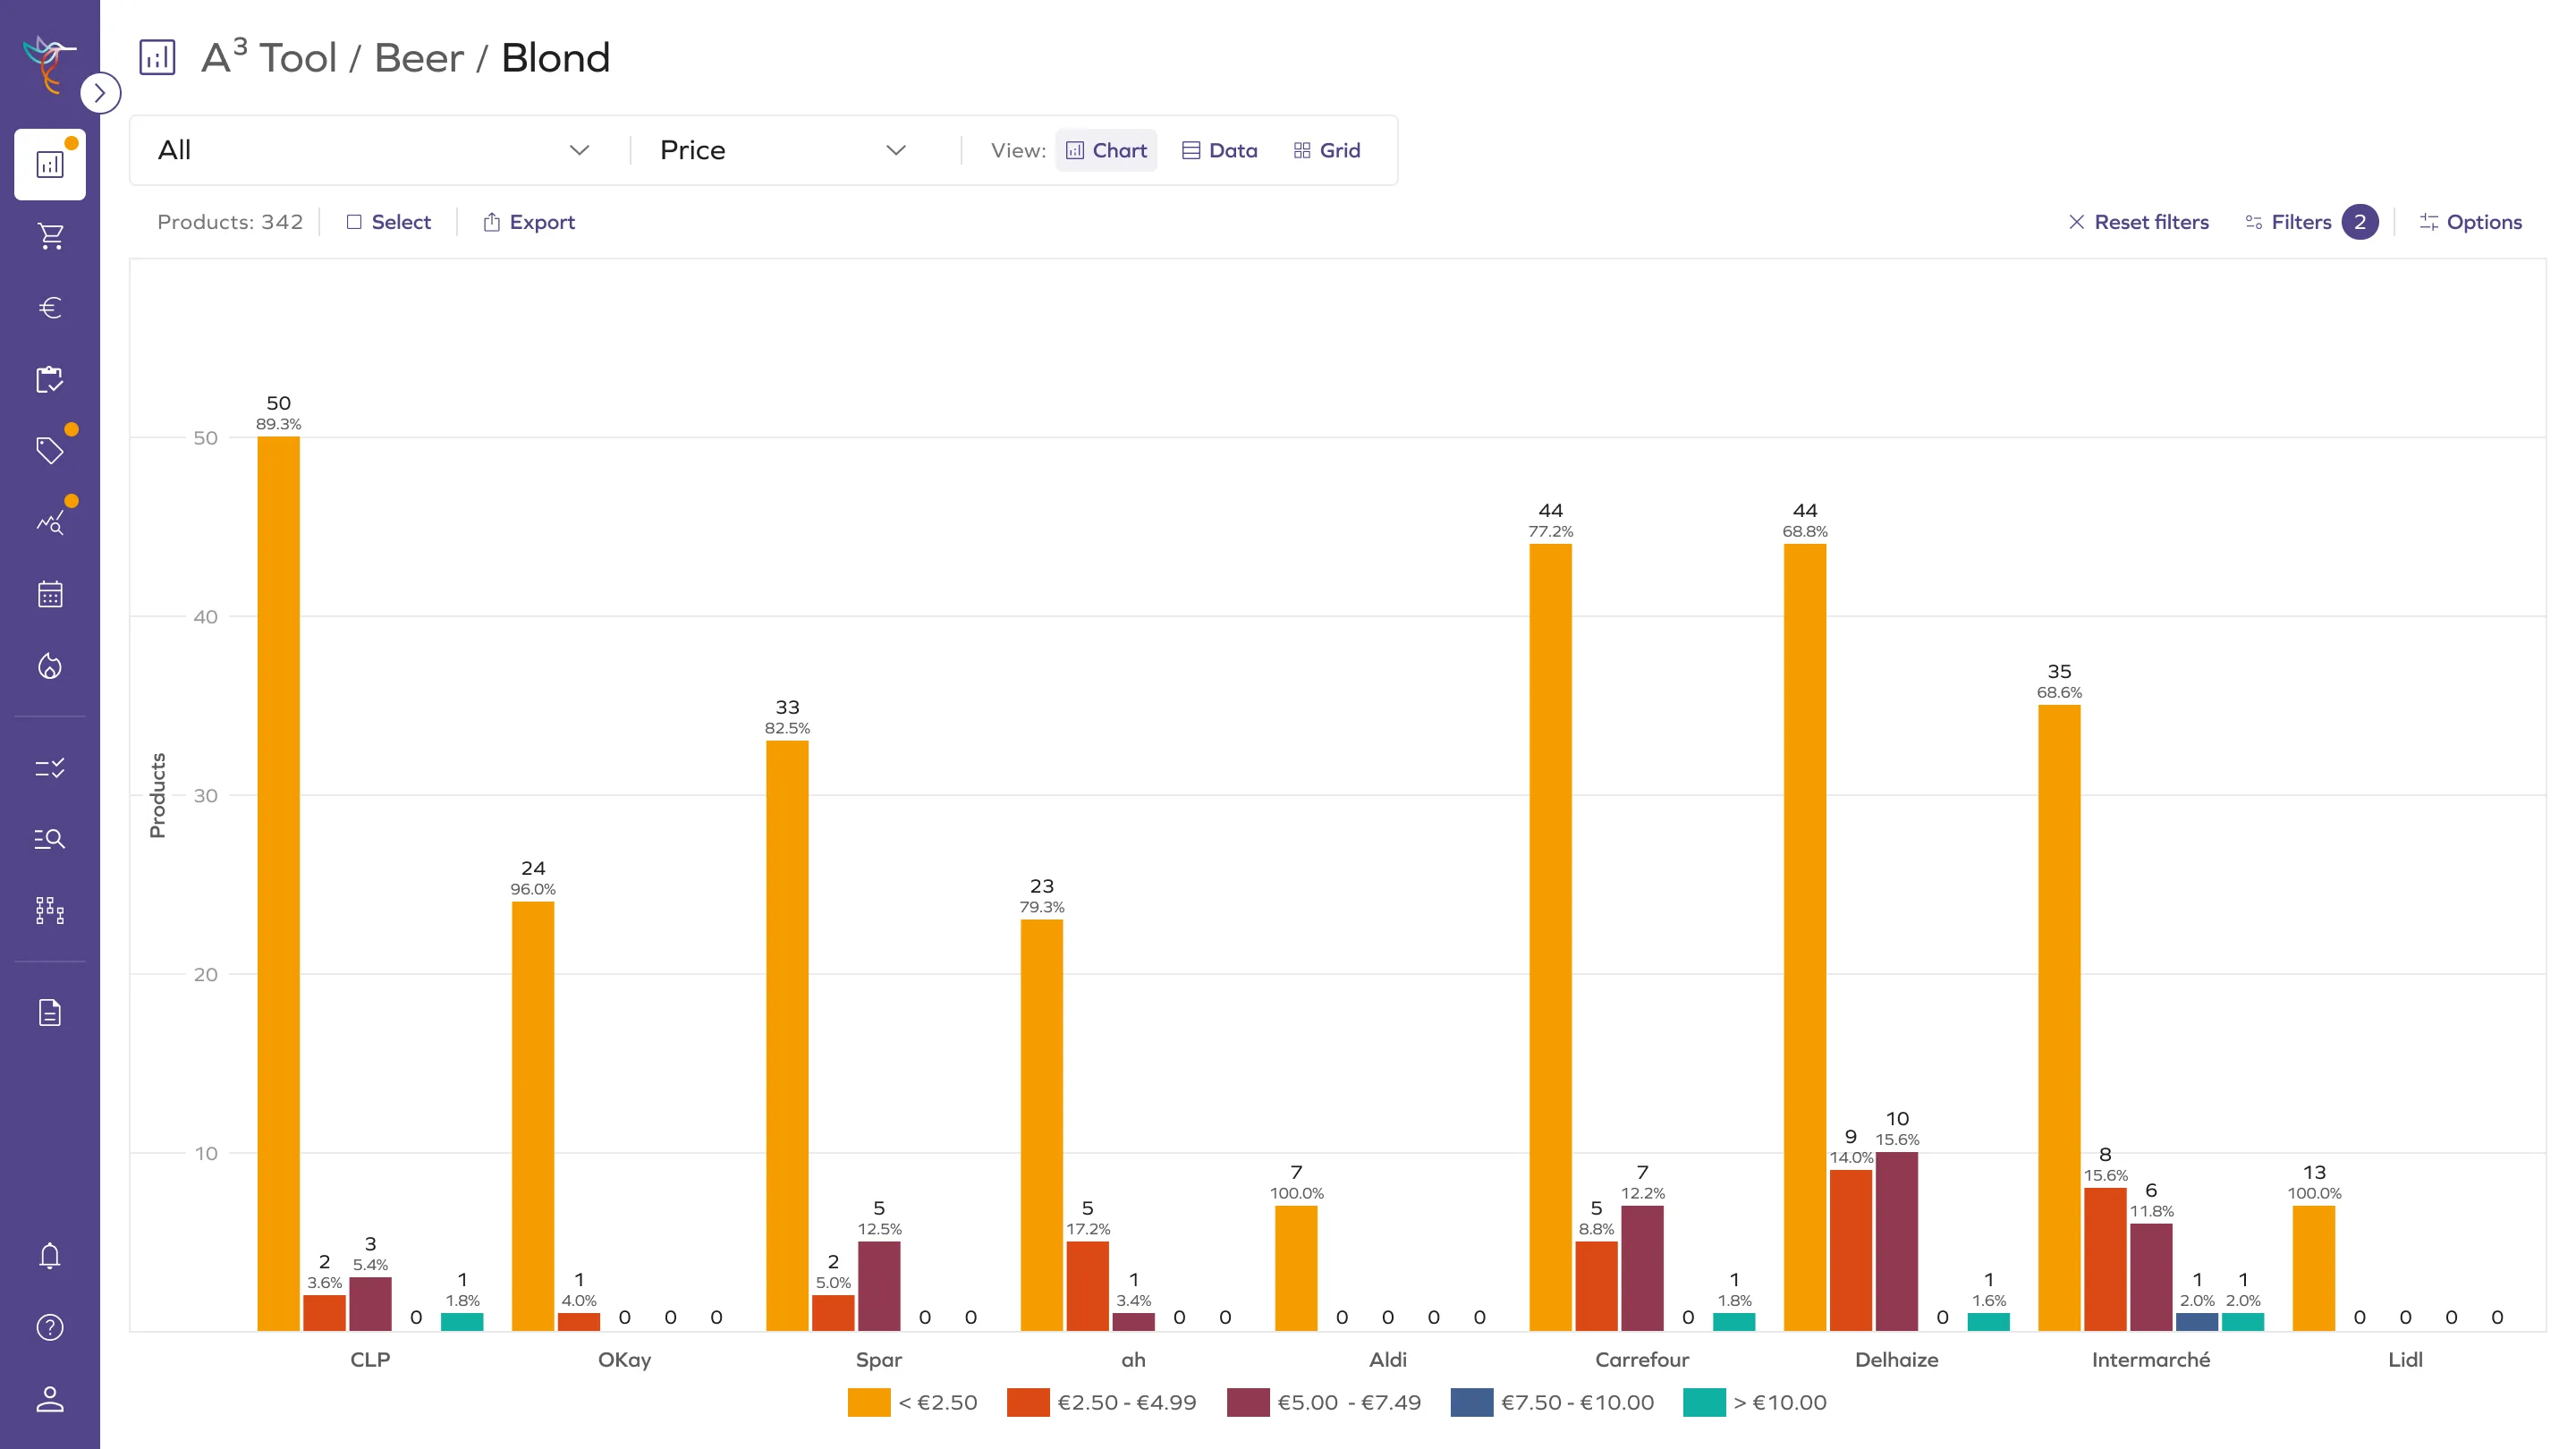
The A³ tool was primarily designed for Category Managers, who reviewed competitor assortments and identified opportunities within a category. However, the platform's structured product data could also support analysis across several other retail roles.
- Category Manager
Review competitor assortments and identify gaps or overlaps within a category - Buyer
Compare product attributes and pricing across suppliers when preparing negotiations - Marketing Manager
Analyse brand presence and product positioning across retailers - Store Manager
Review regional assortment differences and store-level product availability
Design & UX Highlights
- Enhanced accessibility of FMCG data dashboards, enabling clients to make faster, fact-based decisions
- Optimized UX/UI for multiple apps, improving usability and efficiency across the full UX lifecycle
- Delivered A³ achieving strong client adoption (~70% at launch, over 80% after one month)
- Established a scalable MUI design system for consistent UI delivery
Impact
- Enabled monthly assortment reviews instead of multi-year cycles
- Reduced analysis time by ~12x and cost by ~5x (marketing claim)
- Increased efficiency and visibility for thousands of attributes
- Strengthened human-in-the-loop AI workflows for expert validation
- Delivered high adoption and satisfaction across multiple retail roles